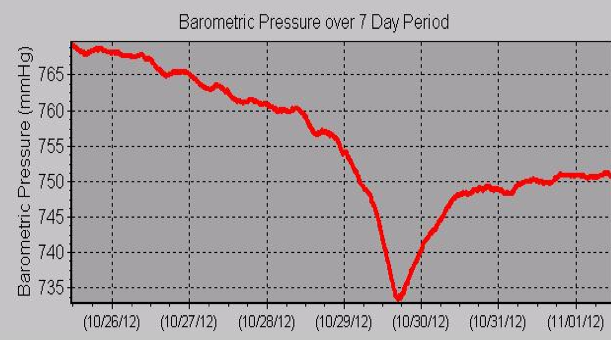
Wesleyan Weather Station Tracks Hurricane Sandy’s Low Air Pressure

The Wesleyan Weather Station recorded a strong drop in local air pressure during Hurricane Sandy on Oct. 29. According to the weather report, the local sea-level barometric pressure was a normal 760 mmHg (millimeters of Mercury) on Oct. 28. When Hurricane Sandy passed through Wesleyan’s campus on Oct. 29, the pressure dropped to a low of 733 mmHg during the storm’s peak.
“Low pressure generally indicates stormy conditions whereas high pressure is associated with fair weather,” explains Johan “Joop” Varekamp, the Harold T. Stearns Professor of Earth Science. “We tend to only see the barometer drop this low in the event of extreme weather.”
The Wesleyan Weather Station also measures the wind speed and direction, and displays graphically changes in temperature and barometric pressure over a seven-day period. During the storm, maximum wind speeds were recorded Sunday around midnight.
The Wesleyan Weather Station was established with a Teaching Innovation Grant from President Michael Roth, and is extensively used in Varekamp’s Global Climate Change class to calculate variations in atmospheric CO2 build-up during day-night cycles that vary with temperature. The station is maintained by Joel LaBella, facilities manager for the Earth and Environmental Sciences Department, Information Technology Services and Varekamp.

