Varekamp Plots Pandemic, Measures Growth Curves in US, Italy


Last March, Johan (Joop) C. Varekamp, Harold T. Stearns Professor of Earth Science, intended to teach an ore deposit and formation class in Italy; however, the COVID-19 pandemic caused him to stay near campus.
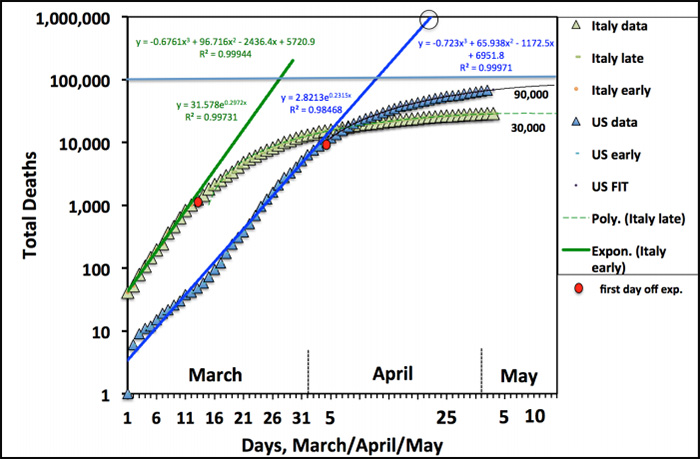
Nevertheless, Varekamp kept a keen watch on Italy. With a fascination with the pandemic’s wildfire spread, Varekamp began plotting coronavirus data from both the United States and Italy to see how their growth curves compared.
“Infectious diseases follow initially exponential growth patterns until measures are taken to limit transmission or a vaccine becomes available,” Varekamp said. “I wanted to know how disease propagation compares to population growth, which I teach in some detail in my classes.”
On May 7, Varekamp shared his ongoing Coronavirus Plot Maps with the campus community through Wesleyan’s Community Forum. His study features some of the differences in the progression of the disease in the two countries that may provide some insights “and possibly some dark thoughts about our future.”
Varekamp suggested that if social distancing rules are weakened too early, the disease will pick up where it left off at the exponential end. “This will all be repeated until about 60–70% of the population has been infected with the disease,” he said. “Only then the virus burns itself out, to some degree as a result of lack of non-immune individuals, and transmission rates will decrease to values below one.”
He also stated that if no social distancing had been ordered in the U.S. in late March, the U.S. would have stuck to its exponential growth pattern, and close to 1 million people would have died by the end of April.
If he’s able to safely fly internationally next year, Varekamp hopes to have another attempt at teaching the EU-coordinated ore deposit class at the University of Bologna.
“It is hard to see how all of this evolves,” he said.

